[Correlation Browser / New Search]
[List of best correlations]
[List of all variables]
[Stats]
[Help/About]
Correlation Browser for the bone dataset: Help/About
This website provides a tool to study correlations between genetic transcripts of the iliac crest bone,
based on a previously published case-control study of N=84 post-menopausal Caucasian women [1].
The original data set is the result of a global gene expression analysis
of 84 iliac crest bone biopsies using Affymetrix Human Genome U133 Plus
2.0 Arrays (quantitating more than 22 000 probesets) and Applied
Biosystems PCR-based LDA cards (adding more than 300 microRNAs or other
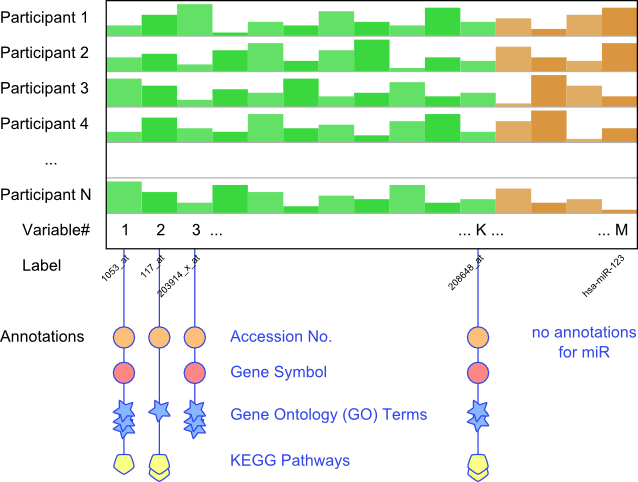
non-coding RNAs). In total, there are approximately 23 000 variables (M) per
participant. All normalized Affymetrix signal values were log-transformed
and the normalized PCR Cq values from the LDA cards were subtracted from
40 in order to get increasing values with increasing expression.
Annotations were added to the M Affymetrix-based variables using the Bioconductor [2] package "hgu133plus2.db"
for the statistical computing environment R [3]. These annotations include direct mappings of each Affymetrix probe
label to, where available, exactly one...
- corresponding NCBI Accession Number,
- Entrez Gene ID,
- official Gene Symbol and
- the more descriptive Gene Name,
as well as to lists of potentially arbitrary length of...
- Gene Ontology (GO) Terms,
- KEGG Pathways and
- chromosome start sites.
Note that any given gene may be associated with several Affymetrix labels.
Note also that no annotations for microRNA were readily available for inclusion into the Correlation Browser.
 From the original N×M data set, an M×M matrix of Pearson product-moment correlation coefficients r
between all possible combinations of variables was calculated in the statistics environment R and saved column-wise
in a MySQL database, along with the aforementioned annotations and the raw p-values that correspond to the r-values and the number
of participants N according to
From the original N×M data set, an M×M matrix of Pearson product-moment correlation coefficients r
between all possible combinations of variables was calculated in the statistics environment R and saved column-wise
in a MySQL database, along with the aforementioned annotations and the raw p-values that correspond to the r-values and the number
of participants N according to
 under Student's t-distribution with N-2 degrees of freedom.
The figure below illustrates a common query in the Correlation Browser: The user requests to view the correlations between
a gene and a subset of all other variables. The program will first identify the variables associated with the gene and those
with the requested subset. It will then fetch columns of r- and p-values corresponding to the former from the database and truncate
them to the subset.
under Student's t-distribution with N-2 degrees of freedom.
The figure below illustrates a common query in the Correlation Browser: The user requests to view the correlations between
a gene and a subset of all other variables. The program will first identify the variables associated with the gene and those
with the requested subset. It will then fetch columns of r- and p-values corresponding to the former from the database and truncate
them to the subset.
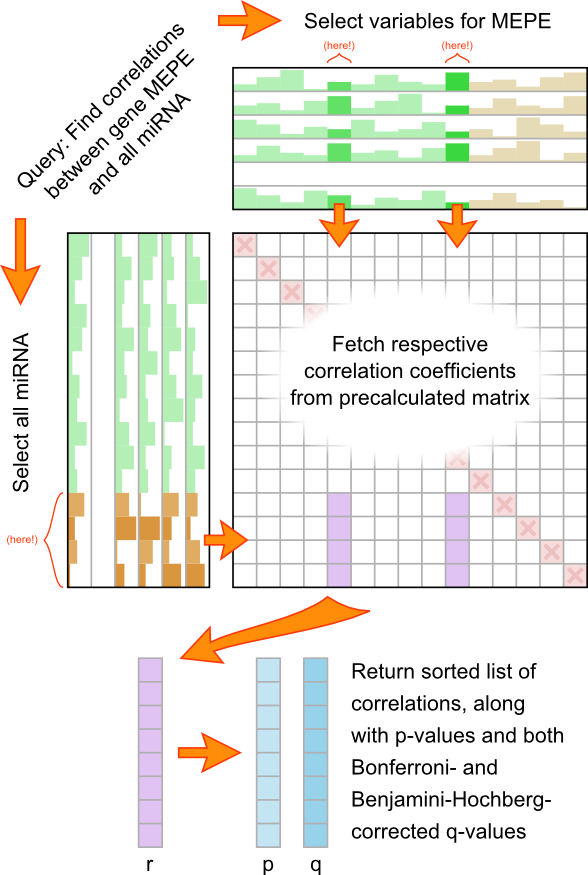 The resulting list is sorted and expanded by calculating, from the raw p-values, the Bonferroni correction q
and the Benjamini-Hochberg False-Discovery Rate [4]. The number of tests to correct for is assumed
to be the number of correlation coefficients in the scope of the user's query, highlighted in purple in the figure above.
In cases where the user's query includes the trivial "self correlations" on the diagonal of the matrix, these are removed
(by default; can be toggled). Correlations between two (or more) variables that belong to the same gene, however, will be
considered in the Bonferroni / BH corrections, but marked in gray in the output list. This behavior is intentional, because
it is the expression variables (and not the genes they represent) that form the statistical basis for the whole correlation analysis.
The resulting list is sorted and expanded by calculating, from the raw p-values, the Bonferroni correction q
and the Benjamini-Hochberg False-Discovery Rate [4]. The number of tests to correct for is assumed
to be the number of correlation coefficients in the scope of the user's query, highlighted in purple in the figure above.
In cases where the user's query includes the trivial "self correlations" on the diagonal of the matrix, these are removed
(by default; can be toggled). Correlations between two (or more) variables that belong to the same gene, however, will be
considered in the Bonferroni / BH corrections, but marked in gray in the output list. This behavior is intentional, because
it is the expression variables (and not the genes they represent) that form the statistical basis for the whole correlation analysis.
References
- Reppe S, Refvem H, Gautvik VT, et al. Eight genes are highly associated with BMD variation in postmenopausal Caucasian women. Bone. 2010;46:604-612.
- R. Gentleman, V. J. Carey, D. M. Bates, B.Bolstad, M. Dettling, S. Dudoit, B. Ellis, L. Gautier, Y. Ge, and others. Bioconductor: Open software development for computational biology and bioinformatics. Genome Biology 2004, Vol. 5, R80
- R Development Core Team (2010). R: A language and environment for statistical computing. R Foundation for Statistical Computing, Vienna, Austria. ISBN 3-900051-07-0, URL http://www.R-project.org/.
- Benjamini Y, Hochberg Y. Controlling the false discovery rate: a practical and powerful approach to multiple testing. Journal of the Royal Statistical Society, Series B (Methodological) 1995;57 (1):289-300.
Correlation Browser 2.0: Daniel Sachse, Sjur Reppe, Kåre Gautvik - 2013.

